Faster Mandelbrots?
Please open notebook rsepython-s6r2.ipynb
Let’s revisit our implementation:
xmin = -1.5
ymin = -1.0
xmax = 0.5
ymax = 1.0
resolution = 300
xstep = (xmax - xmin) / resolution
ystep = (ymax - ymin) / resolution
xs = [(xmin + (xmax - xmin) * i / resolution) for i in range(resolution)]
ys = [(ymin + (ymax - ymin) * i / resolution) for i in range(resolution)]
def mandel1(position, limit=50):
    value = position
    while abs(value) < 2:
        limit -= 1
        value = value**2 + position
        if limit < 0:
            return 0
    return limit
data1=[[mandel1(complex(x,y)) for x in xs] for y in ys]
Many Mandelbrots
Let’s compare our naive python implementation which used a list comprehension, taking 662ms, with the following:
%%timeit
data2 = []
for y in ys:
    row = []
    for x in xs:
        row.append(mandel1(complex(x, y)))
    data2.append(row)
1 loop, best of 3: 725 ms per loop
data2 = []
for y in ys:
    row = []
    for x in xs:
        row.append(mandel1(complex(x, y)))
    data2.append(row)
Interestingly, not much difference. I would have expected this to be slower, due to the normally high cost of appending to data.
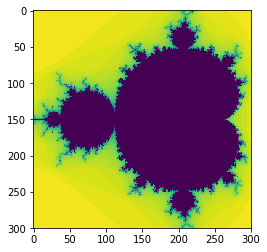
As before, we can plot our results to quickly check the output.
from matplotlib import pyplot as plt
%matplotlib inline
plt.imshow(data2,interpolation='none')
<matplotlib.image.AxesImage at 0x7fbf10136fd0>

We ought to be checking if these results are the same by comparing the values in a test, rather than re-plotting. This is cumbersome in pure Python, but easy with NumPy, so we’ll do this later.
Let’s try a pre-allocated data structure:
data3=[[0 for i in range(resolution)] for j in range(resolution)]
%%timeit
for j, y in enumerate(ys):
    for i, x in enumerate(xs):
        data3[j][i] = mandel1(complex(x,y))
1 loop, best of 3: 741 ms per loop
And again check that we’ve not made a mistake in the algorithm.
for j, y in enumerate(ys):
    for i, x in enumerate(xs):
        data3[j][i] = mandel1(complex(x,y))
plt.imshow(data3,interpolation='none')
<matplotlib.image.AxesImage at 0x7fbf0ffb5c88>
Nope, no gain there.
Let’s try using functional programming approaches:
%%timeit
data4 = []
for y in ys:
    bind_mandel = lambda x: mandel1(complex(x, y))
    data4.append(list(map(bind_mandel, xs)))
1 loop, best of 3: 720 ms per loop
data4=[]
for y in ys:
    bind_mandel=lambda x: mandel1(complex(x, y))
    data4.append(list(map(bind_mandel,x s)))
plt.imshow(data4, interpolation='none')
<matplotlib.image.AxesImage at 0x7fbf0fef67f0>

That was a tiny bit slower.
So, what do we learn from this? Our mental image of what code should be faster or slower is often wrong, or doesn’t make much difference. The only way to really improve code performance is empirically, through measurements.