Solution
The solution has been broken down into the individual steps of the exercise.
The solution notebook can be downloaded from:
https://anaconda.org/ucl-rits/module16-quakesolution/notebook
Set-up
%matplotlib inline
from matplotlib import pyplot as plt
Download the data
import requests
quakes_response=requests.get("http://earthquake.usgs.gov/fdsnws/event/1/query.geojson",
                    params={
        'starttime':"2000-01-01",
        "maxlatitude":"58.723",
        "minlatitude":"50.008",
        "maxlongitude":"1.67",
        "minlongitude":"-9.756",
        "minmagnitude":"1",
        "endtime":"2015-07-13",
        "orderby":"time-asc"}
                   )
quakes_response
« <Response [200]>
type(quakes_response)
« requests.models.Response
Parsing the data
import json
requests_json = json.loads(quakes_response.text)
Investigate the data to discover how it is structured
type(requests_json)
« dict
requests_json.keys()
« dict_keys([‘metadata’, ‘bbox’, ‘features’, ‘type’])
type(requests_json['features'])
« list
len(requests_json['features'])
« 110
type(requests_json['features'][0])
« dict
requests_json['features'][0].keys()
« dict_keys([‘geometry’, ‘properties’, ‘id’, ‘type’])
requests_json['features'][0]['properties']['mag']
« 2.6
requests_json['features'][0]['geometry']['coordinates']
« [-2.81, 54.77, 14]
Find the largest quake
quakes = requests_json['features']
largest_so_far = quakes[0]

for quake in quakes:
    if quake['properties']['mag'] > largest_so_far['properties']['mag']:
        largest_so_far = quake

largest_so_far
{‘geometry’: {‘coordinates’: [-2.15, 52.52, 9.4], ‘type’: ‘Point’},
‘id’: ‘usp000bcxg’,
‘properties’: {‘alert’: None,
‘cdi’: None,
‘code’: ‘p000bcxg’,
‘detail’: ‘https://earthquake.usgs.gov/fdsnws/event/1/query?eventid=usp000bcxg&format=geojson’,
‘dmin’: None,
‘felt’: None,
‘gap’: None,
‘ids’: ‘,usp000bcxg,atlas20020922235314,’,
‘mag’: 4.8,
‘magType’: ‘mb’,
‘mmi’: 6.1,
‘net’: ‘us’,
‘nst’: 268,
‘place’: ‘England, United Kingdom’,
‘rms’: None,
‘sig’: 354,
‘sources’: ‘,us,atlas,’,
‘status’: ‘reviewed’,
‘time’: 1032738794600,
‘title’: ‘M 4.8 - England, United Kingdom’,
‘tsunami’: 0,
‘type’: ‘earthquake’,
‘types’: ‘,impact-text,origin,phase-data,shakemap,trump-shakemap,’,
‘tz’: None,
‘updated’: 1493229637141,
‘url’: ‘https://earthquake.usgs.gov/earthquakes/eventpage/usp000bcxg’},
‘type’: ‘Feature’}
print(largest_so_far['properties']['mag'])
« 4.8
lat=largest_so_far['geometry']['coordinates'][1]
long=largest_so_far['geometry']['coordinates'][0]
print("Latitude:", lat, "Longitude:", long)
« Latitude: 52.52 Longitude: -2.15
Get a map at the point of the quake
import requests
def request_map_at(lat,long, satellite=False,zoom=12,size=(400,400),sensor=False):
  base="http://maps.googleapis.com/maps/api/staticmap?"

  params=dict(
    sensor= str(sensor).lower(),
    zoom= zoom,
    size= "x".join(map(str,size)),
    center= ",".join(map(str,(lat,long)))
  )
  if satellite:
    params["maptype"]="satellite"

  return requests.get(base,params=params)
import IPython
map_png=request_map_at(lat, long,zoom=10)
Display the map
IPython.core.display.Image(map_png.content)

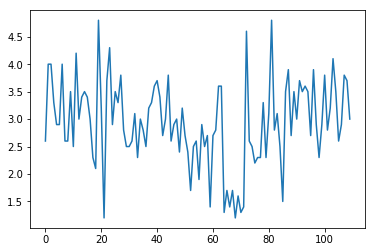
plt.plot([ quake['properties']['mag'] for quake in quakes ])
« [<matplotlib.lines.Line2D at 0x2b99ff534ac8>]